
Nowadays, everyone uses Microsoft Office daily. if you may want to change the scale Excel uses along an axis of your chart. The horizontal (category) axis, also known as the x axis, of a chart displays text labels instead of numeric intervals and provides fewer scaling options than are available for a vertical (value) axis, also known as the y axis, of the chart. Excel includes an impressive graphing capability that can turn the dullest data into outstanding charts, complete with all sorts of whiz-bang do-dads to amaze your friends and confound your enemies. in this article we will show you how to change x axis scale in excel.
How to change axis scale used by excel?
Excel users have a wide range of different options to choose from when it comes to the kind of chart or graph they want to create. You can change the scale used by Excel by following these steps:
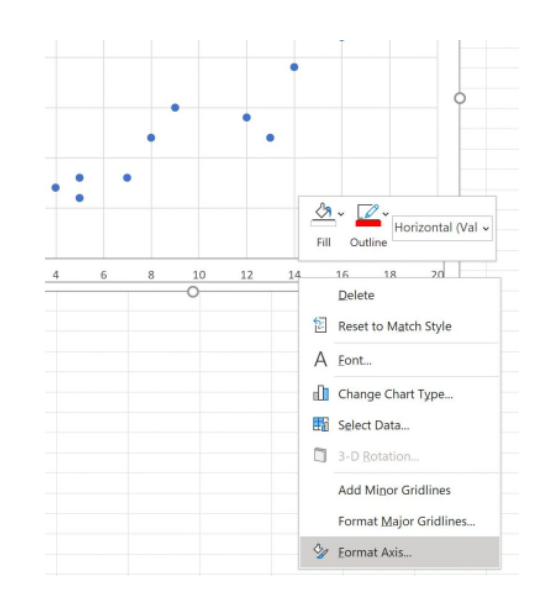
- Right-click on the axis whose scale you want to change. Excel displays a Context menu for the axis.
- Choose Format Axis from the Context menu. (If there is no Format Axis choice, then you did not right-click on an axis in step 1.) Excel displays the Format Axis dialog box.
- Make sure the Scale tab is selected.
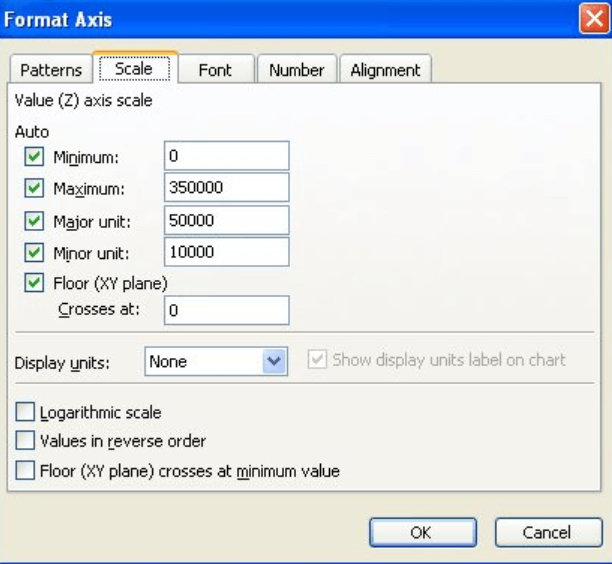
- Adjust the scale settings, as desired.
- Click on OK.
Change x axis scale in excel chart on Windows or Mac:
On Windows:
To change the scale of other axes in a chart, see following steps:
In a chart, click to select the category axis and select the axis from a list of chart elements:
- Click anywhere in the chart.
- This displays the Chart Tools, adding the Design and Format tabs.
- On the Format tab, click Horizontal (Category) Axis.
- On the Format tab, in the Current Selection group, click Format Selection.
- In the Format Axis pane, do any of the following:
- To reverse the order of categories, expand Axis Options, and then select the Categories in reverse order check box.
- To change the point where you want the vertical (value) axis to cross the horizontal and vertical (value) axis .
- To change the placement of axis labels, expand Labels, and then in the Distance from axis box, type the number that you want.
On Mac:
When a value axis covers a very large range, you can also change the axis to a logarithmic scale also known as log scale. This step applies to Word for Mac only: On the View menu, click Print Layout.
- Click the chart.
- On the Format tab, click Horizontal (Category) Axis in the dropdown list and then click Format Pane.
- In the Format Axis pane, do any of the following:
- To reverse the order of categories, expand Axis Options, and then select the Categories in reverse order check box.
- To change the point where you want the vertical (value) axis to cross the horizontal (category) axis, expand Axis Options, and then under Vertical axis crosses, select At category number and type the number that you want in the text box, or select At maximum category to specify that the vertical (value) axis cross the horizontal (category) axis after the last category on the x-axis.
- To change the placement of axis labels, expand Labels, and then in the Distance from axis box, type the number that you want.
Example to change x-axis scales in excel plots:
Step-by-step to change the x-axis scales on plots in Excel.
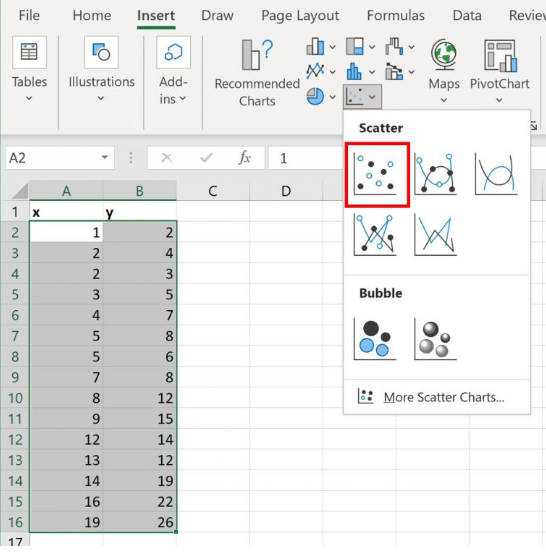
- First, let’s enter a simple dataset into Excel:
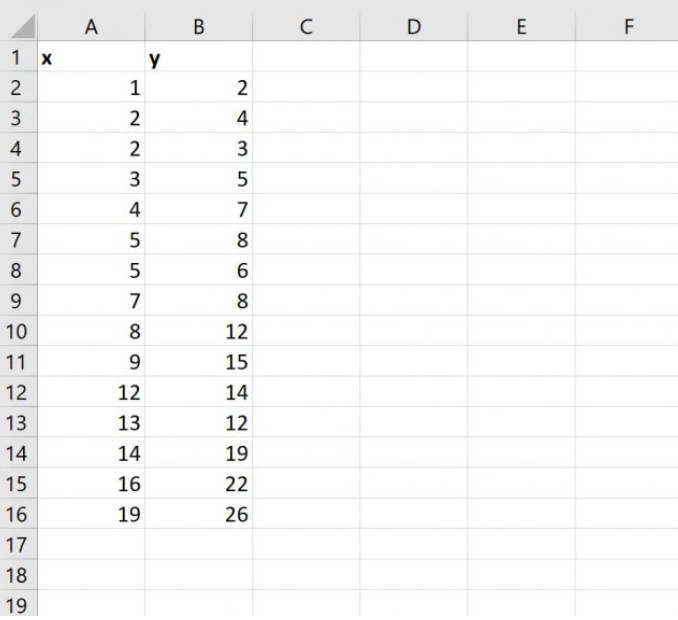
- Create a Scatterplot and highlight the cells in the range A2:B16. Then click the Insert tab along the top ribbon and then click the Scatter option within the Charts group:
- The following scatterplot will automatically be created:
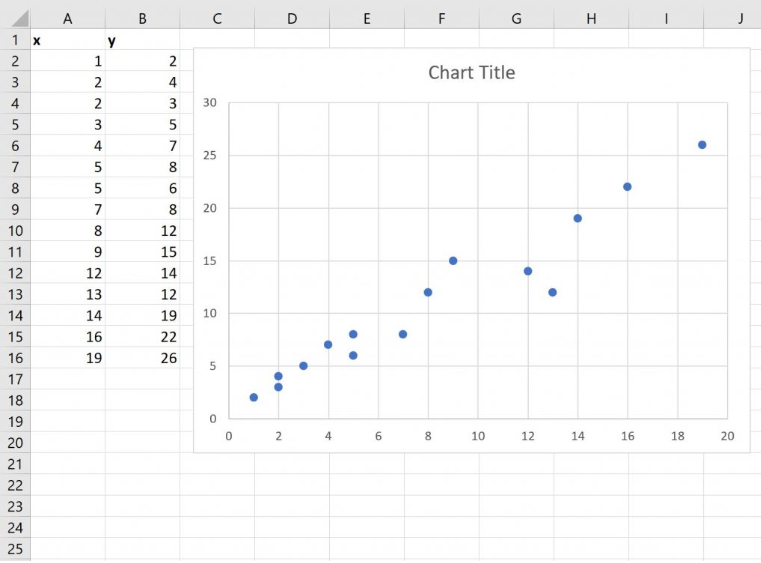
- Change the Axis Scales for the x-axis and y-axis that ranges roughly from the minimum to maximum values in each column.
- In this example, we can see that the x-axis ranges from 0 to 20 and the y-axis ranges from 0 to 30.
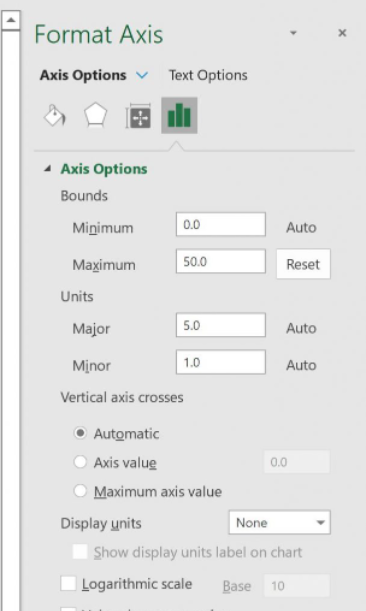
- In the Format Axis panel that appears on the right side of the screen, change the values in the Minimum and Maximum boxes to change the scale of the x-axis.
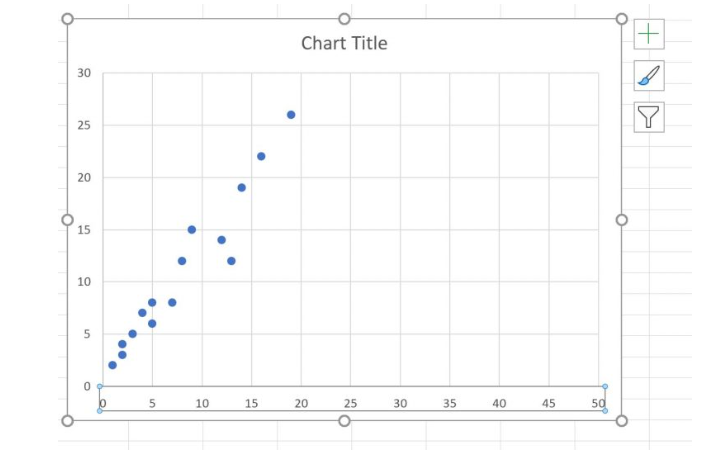
- For example, we could change the Maximum value of the x-axis to 50:
- Once we press Enter, the x-axis scale will automatically be updated on the plot:
- The x-axis will automatically be updated to use a logarithmic scale:
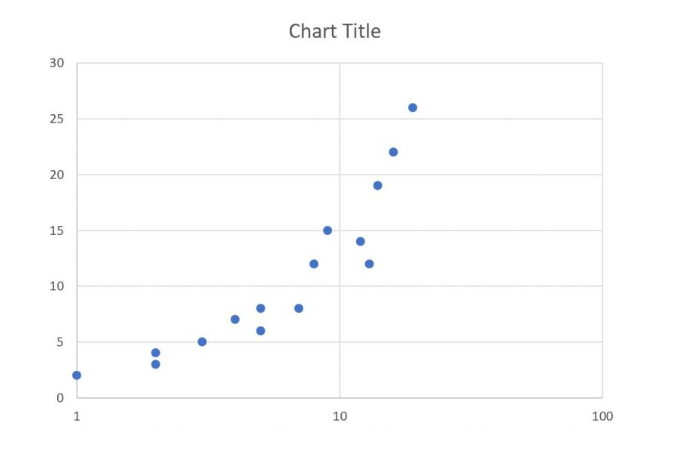
- In these examples, we chose to change only the x-axis scale.