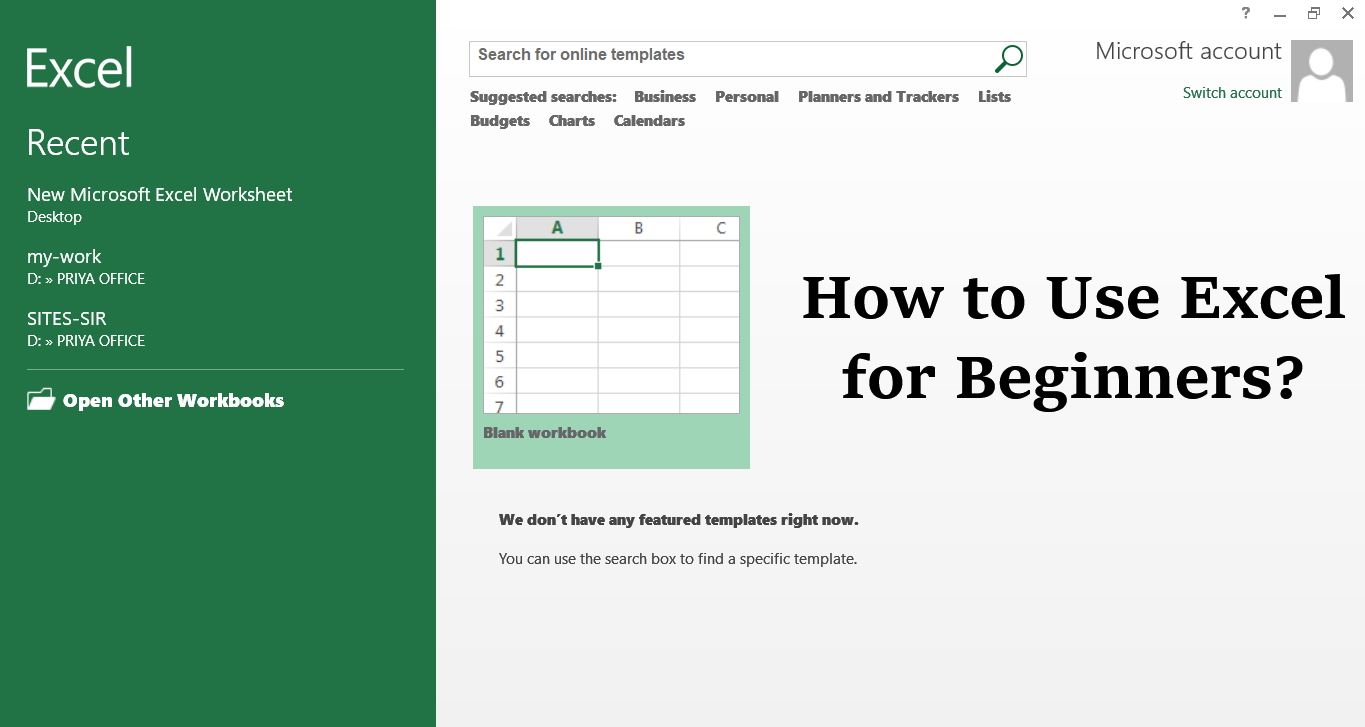
Are you new to Microsoft Excel and need to work on a spreadsheet? Don’t worry—once you learn how to use excel for beginners, you’ll be entering, manipulating, calculating, and graphing data in no time!
What are Excel and its features?
Microsoft Excel is a spreadsheet (computer application that allows storage of data in a tabular form) developed by Microsoft. It can be used on Windows, macOS, IOS, and Android platforms. Some of its features include:
- Graphing tools
- Functions (Count, sum, text, date and time, financial, etc)
- Data Analysis (Filters, charts, tables, etc)
- Visual Basic for Application (VBA)
- Contains 300 examples for you
- Workbooks and worksheets
- Data Validation, etc
How do you use Excel for beginners step by step?
If you’re just starting out with Excel, there are a few basic steps that help how to use excel for beginners. These are things like:
Create New Workbook
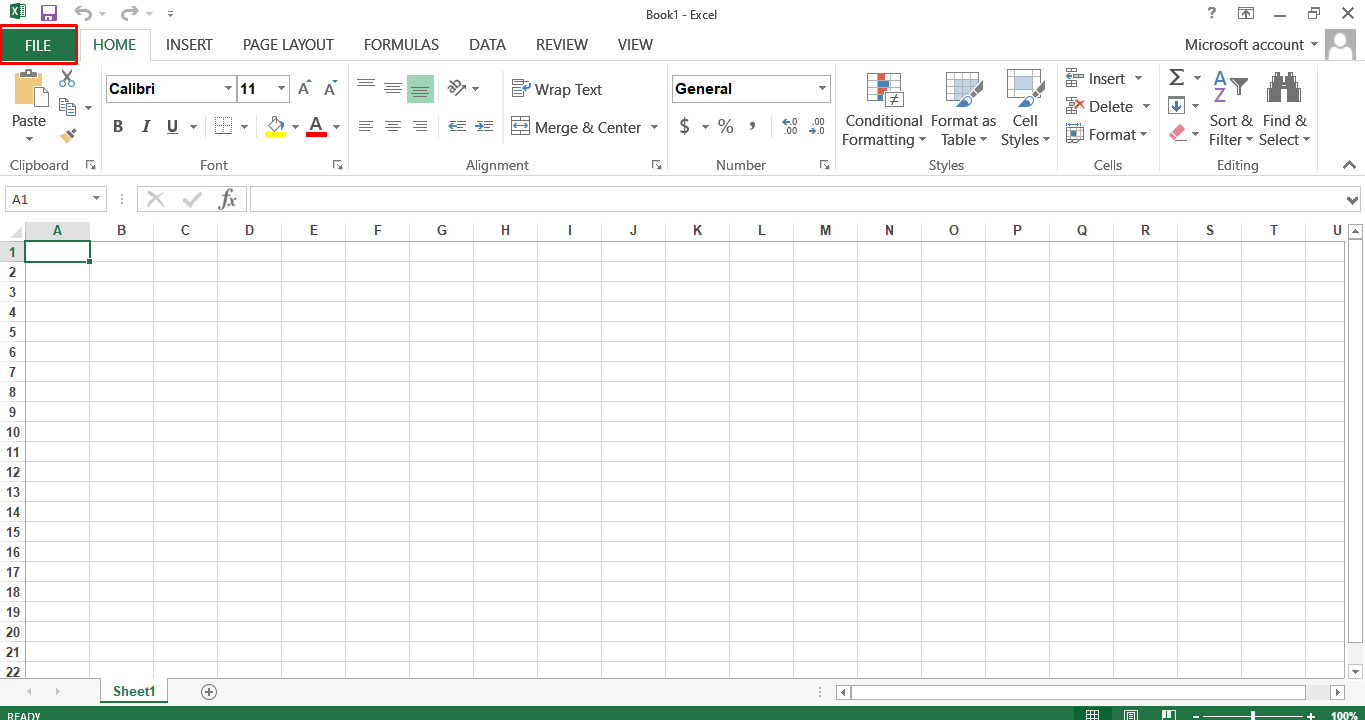
- Open Microsoft Excel and Click File.
- Select New.
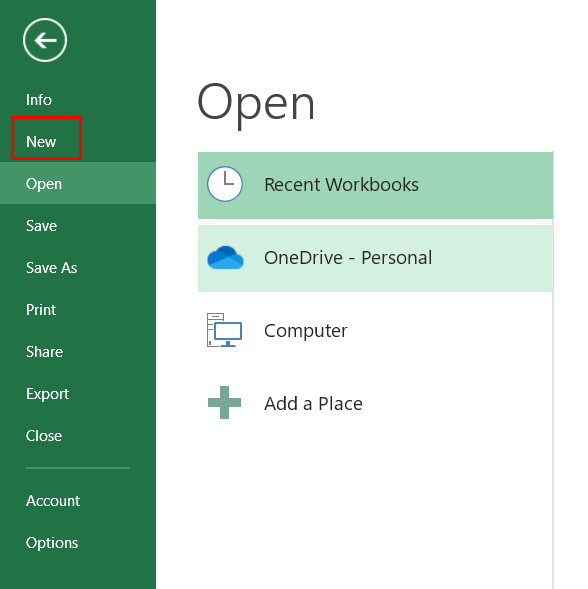
- Click Blank Workbook.
Enter Data
To create a new blank workbook, you’ll have a single worksheet named Sheet1 (see this on the bottom tab) containing a grid for your data. Worksheets are made up of individual cells arranged in columns and rows.
Note: To add another worksheet, just click the + next to the worksheet tab(s).
- Select an empty cell and then Enter text or a number in the cell and press enter.
Apply Cell Border
- Choose the cell or range of cells that you want to add a border to.
- Click the Border list arrow from the Home tab.
Note: A list of borders you can add to the selected cell(s) appears. Use the examples shown next to each border option to decide which border type will work best for you.
- Select a border type.
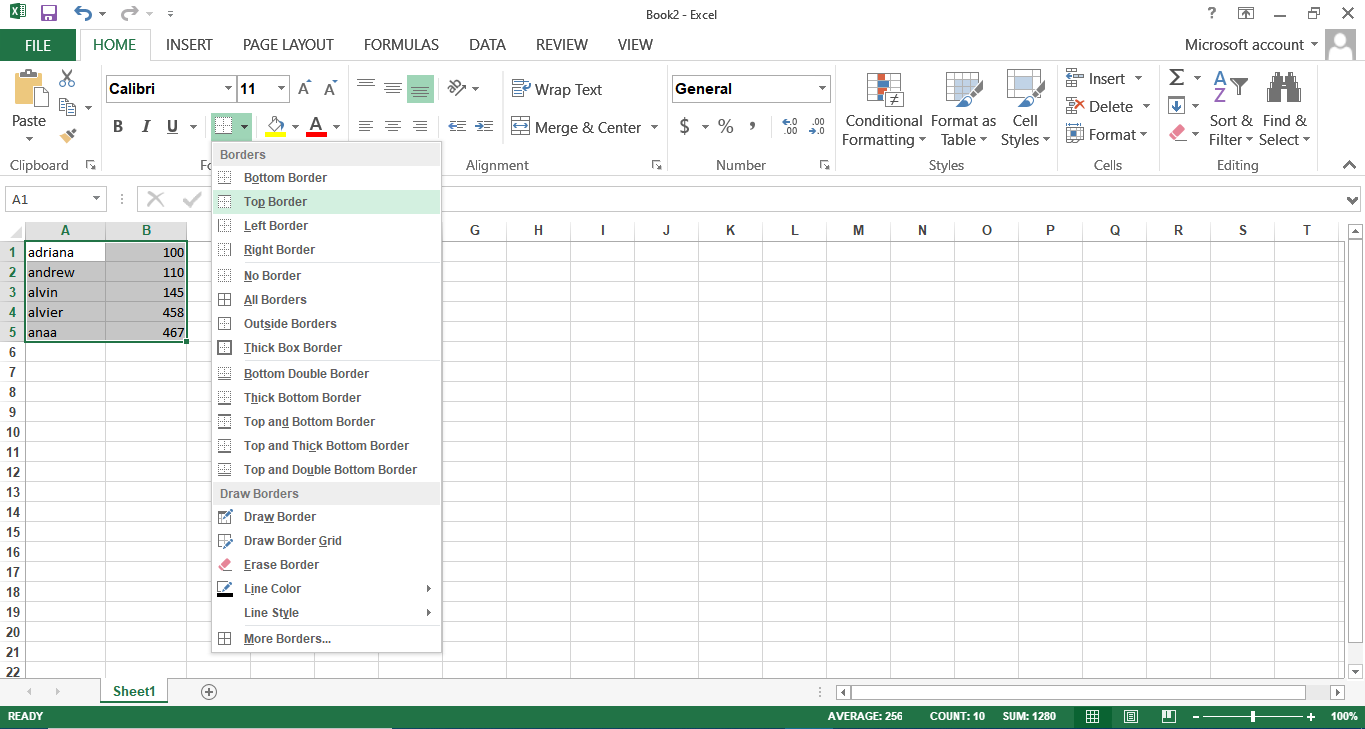
Note: To remove a border, click the Border list arrow in the Font group and select No Border.
Apply cell shading
- Select the cell or range of cells you want to apply cell shading.
- Choose the arrow next to Fill Color on the Home tab, and then under Theme Colors, select the color that you want.
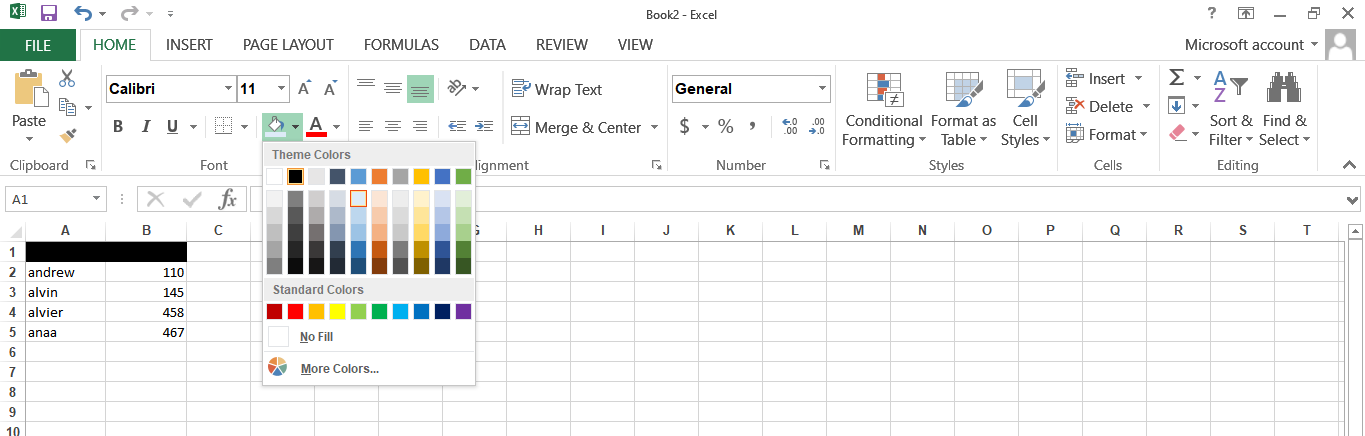
- To fill cells with a custom color, click the arrow next to Fill Color Button image, click More Colors, and then in the Colors dialog box select the color that you want.
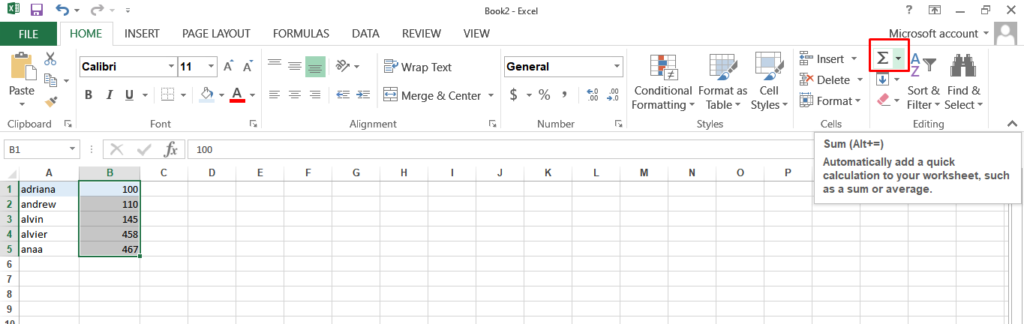
Use AutoSum to sum your data
Select a cell next to the numbers you want to sum, and then click AutoSum on the Home tab, press Enter, and you’re done.
Create a simple Formula
- On the worksheet, click the cell in which you want to enter the formula.
- Type a combination of numbers and calculation operators, like the plus sign (+) for addition, the minus sign (-) for subtraction, the asterisk (*) for multiplication, or the forward slash (/) for division.
- Press Enter (Windows) or Return (Mac).
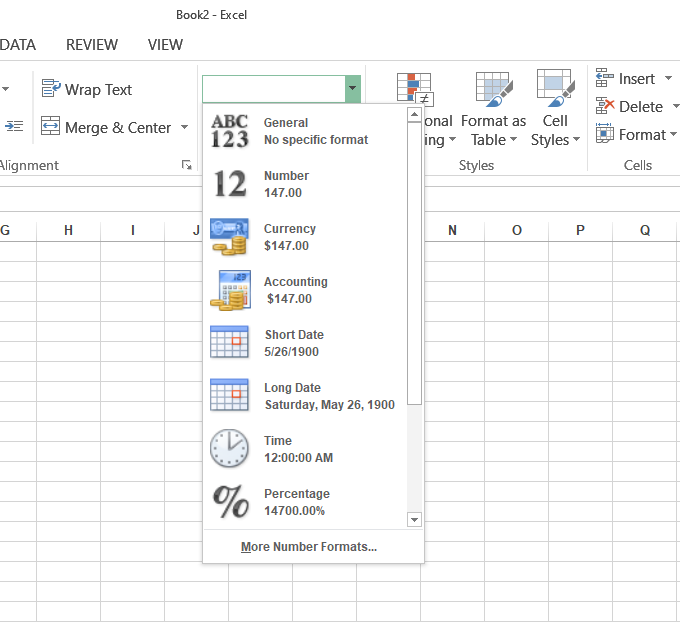
Apply a number format
- Select the cell or range of cells that you want to format.
- Click the arrow in the General box on the home tab.
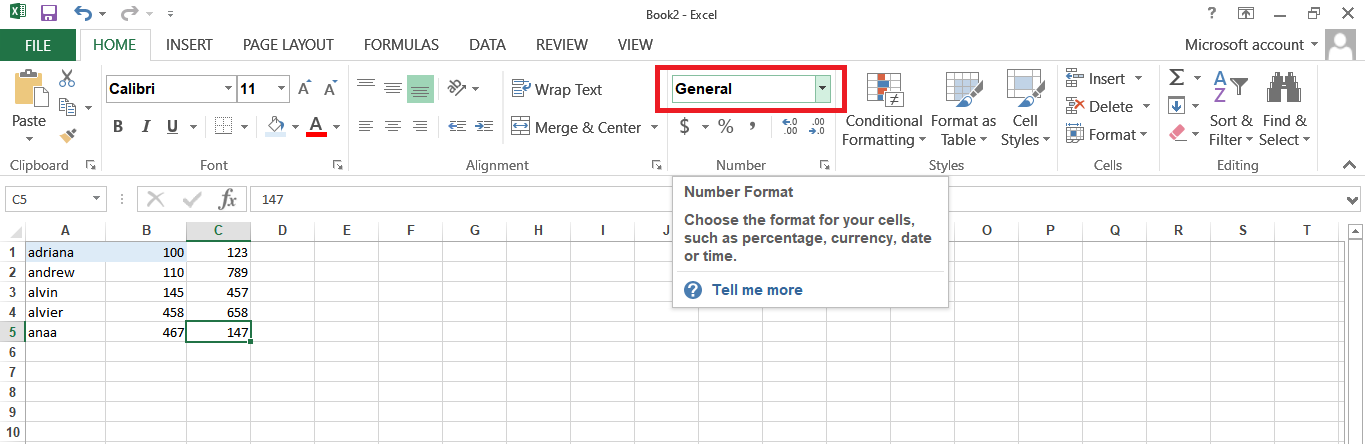
- Choose a number format.
Put your data in a table
- Choose your data by clicking the first cell and dragging it to the last cell.
- Click the Quick Analysis button.
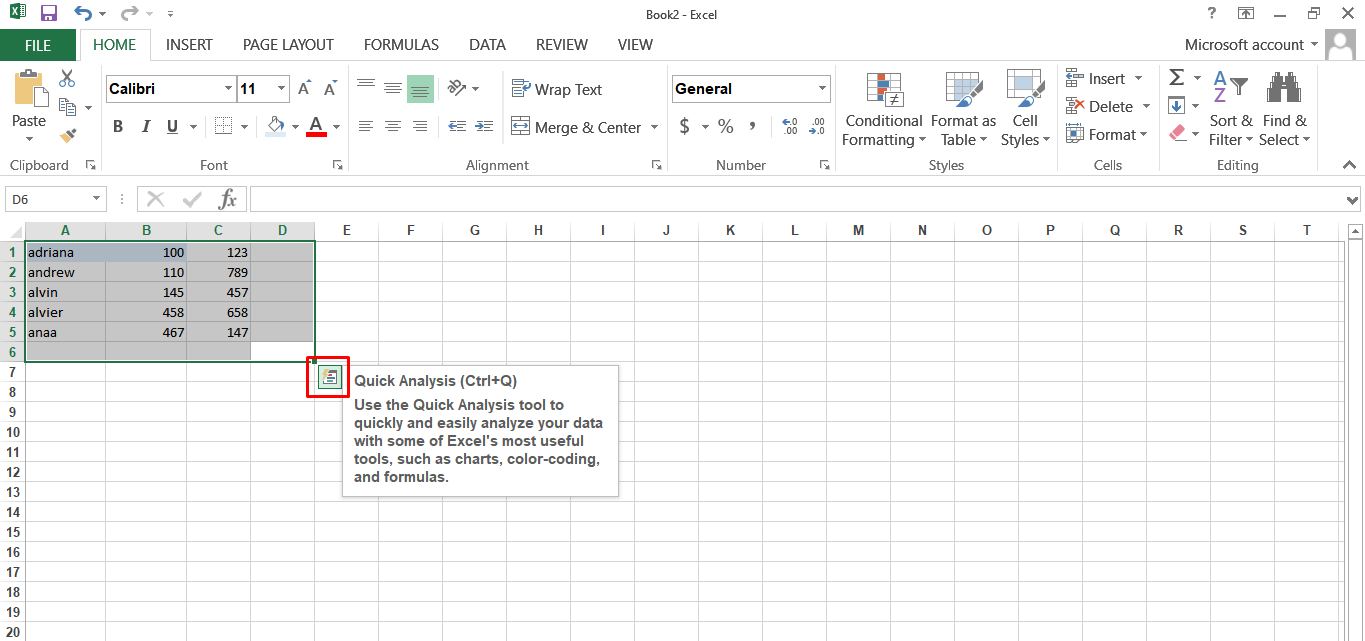
- Click Tables, move your cursor to the Table button to preview your data, and then select the Table button.
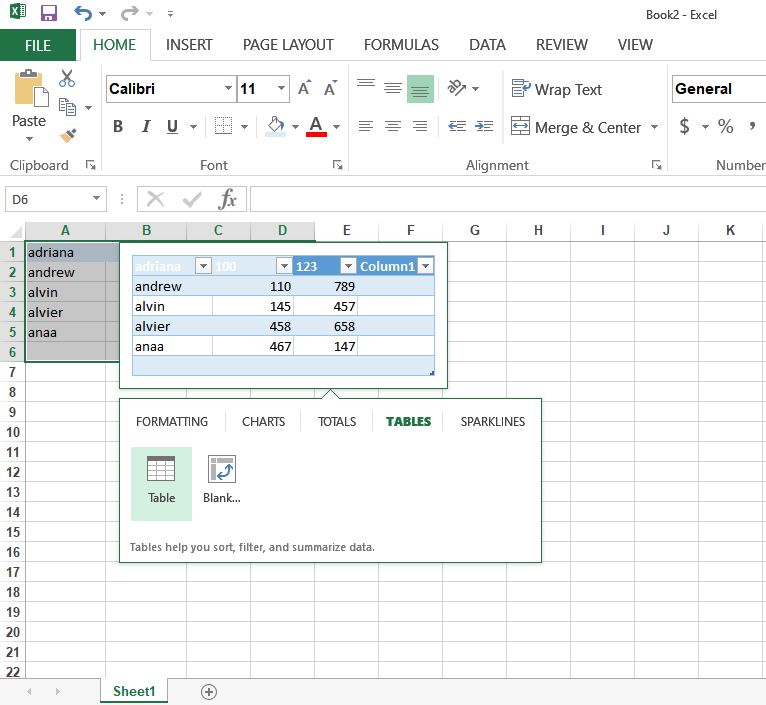
- To filter the data, clear the Select All check box, and then select the data you want to show in your table.
- Click Sort A to Z or Sort Z to A and then Click OK.
Add meaning to your data
- Choose the data you want to examine more closely and then click the Quick Analysis button.
- Explore the options on the Formatting and Sparklines tabs.
- Formatting: Use the Formatting gallery to differentiate high, medium, and low temperatures.
- Sparklines: Use sparklines to show trends in a series of values, such as seasonal increases or decreases, economic cycles, or to highlight maximum and minimum values.
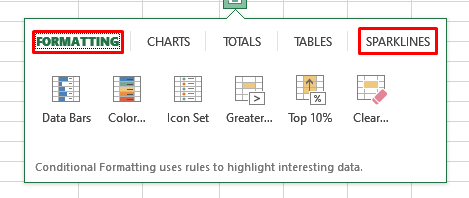
- When you like what you see, click that option.
Show your data in a chart
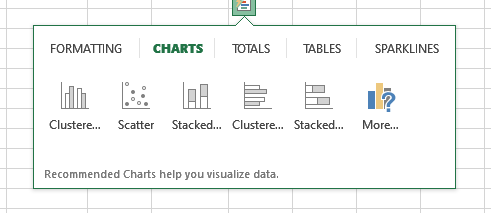
- Choose the cells that contain the data you want to show in a chart.
- Click the Quick Analysis.
- Click the Charts tab, and then click the one that you want.
Sort your data
- Select a cell in the column you want to sort by.
- Select the Data tab, then click the A-Z command to sort A to Z, or the Z-A command to sort Z to A.
Filter your data
- Choose the data that you want to filter.
- On the Data tab, select Filter.
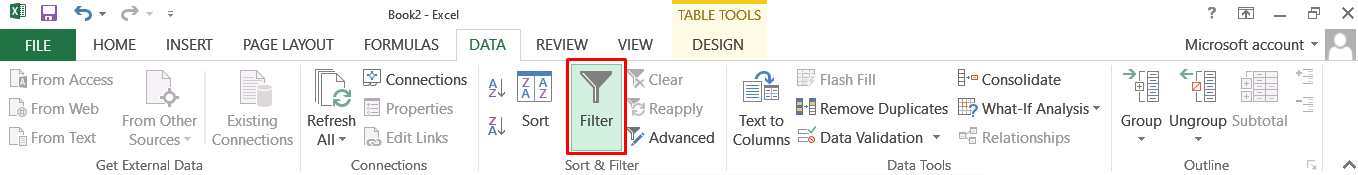
- Select the column header arrow.
- Select Text Filters or Number Filters, and then select a comparison, like Between.
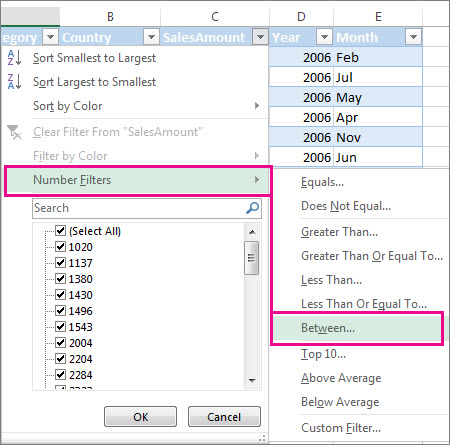
- Enter the filter criteria and select OK.
Save your work
- Click File > Save As.
- Under Save As, pick the place where you want to save your workbook.
- Click Browse to find the location you want in your Documents folder.
- In the File name box, enter a name for a new workbook. Enter a different name if you’re creating a copy of an existing workbook.
- To save your workbook in a different file format (like .xls or .txt), in the Save as type list (under the File name box), pick the format you want.
- Click Save.
Print your work
- Click the File tab, and then click Print or press Ctrl+P.
- Select the Print button or adjust Settings before you select the Print button.