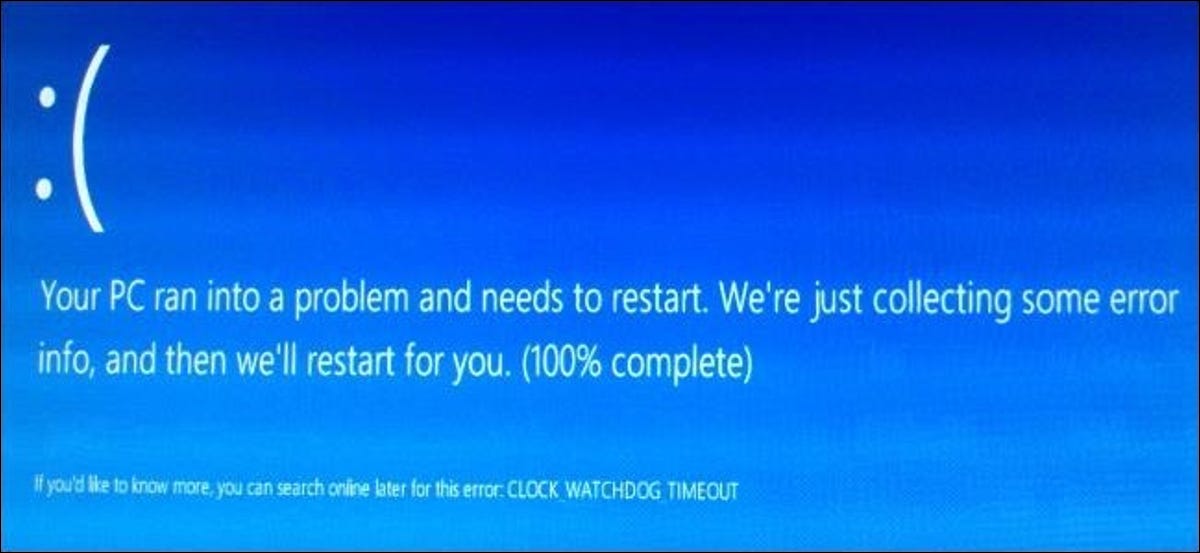
In this article we will discuss about “how to read memory DMP“. Dump files are a special type of files that store information about your computer, the software on it, and the data loaded in the memory when something bad happens. They are usually automatically generated by Windows or by the apps that crash, but you can also manually generate them. When Blue Screen of Death (BSOD) error occurs in your Windows PC. The most obvious is that your PC is forced to restart, as a BSOD results in a complete crash of Windows. you can also read about kmode exception not handled.
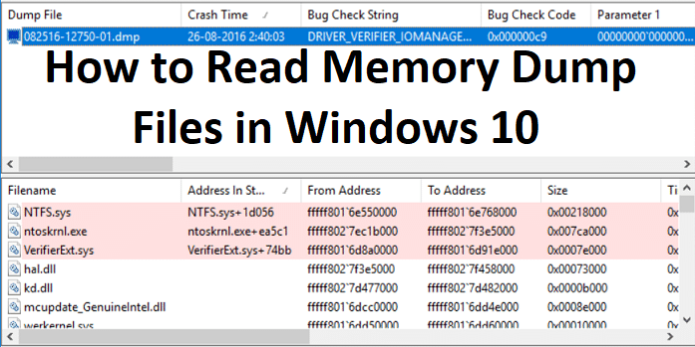
What are memory DMP files?
Blue Screen of Death is a critical and irreversible error on Windows PC, but the cause of these errors can be different. BSOD can have various causes, including corrupt system files. This is called a memory dump file, which is saved in the DMP file format. These files contain various information about the problem, including your current Windows version, any running apps and drivers at the time of the BSOD, and the error codes themselves.
To help you troubleshoot the problem, Windows automatically creates a memory dump file. This usually includes the name and value of the stop code, a list of any drivers driving at the time of the accident, and some additional technical information that you can use to identify the cause.
DMP files are automatically saved in the root C:\, C:\minidump, or C:\Windows\minidump folders. To help you analyze them, you can install WinDbg, Microsoft’s debugging app from the Microsoft Store. It helps you analyze memory dump files and locate stop code information.
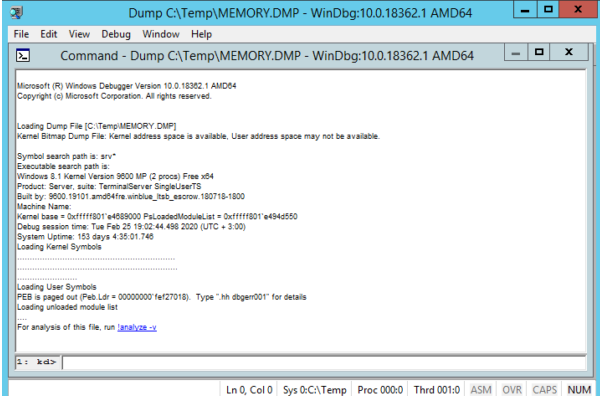
DMP file helps to determine the cause of operating system failure and determine the process that may have caused the OS to shut down. To read the MEMORY.DMP file, you will need a special utility: Debugging Tools for Windows (WinDbg)which is part of Windows 10 SDK. The memory dump file can be several gigabytes in size, so special tools are required to analyze it.
MEMORY.DMP emergency memory DUMP Read:
- You can Run the installed WinDbg utility and select Open Crash Dump in the File menu.
- In the file opening window, go to the MEMORY.DMP file path and open it
- After studying the headlines, click on the link: analyze -v or enter this command manually.
- Waiting for some time for the utility to read the file and search for errors
- Analyzing information about the process that caused Windows to crash.
Use blue screen view to analyze the minidump file:
Follow these steps minutely to do so:
- Download BlueScreenView on your computer. (Visit the website and scroll down through the page, click on the particular file matching with the CPU-architecture (32-bit or 64-bit) to download it).
- After downloading the file on your computer, extract the “bluescreenview-x64.zip” file in a location of your choice.
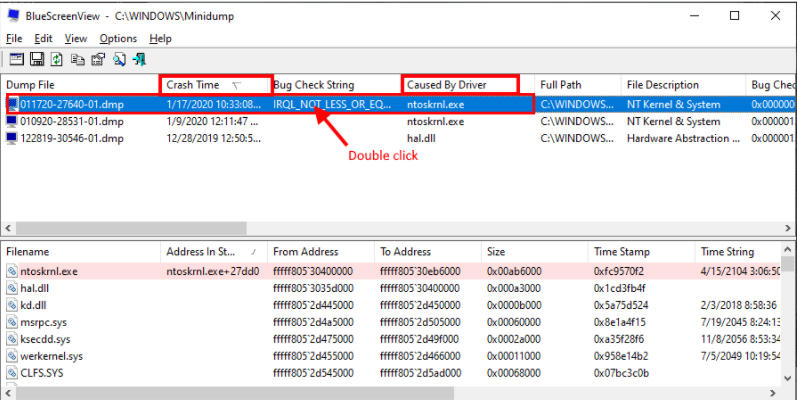
- After extracting the zip file, go to the extraction site on your computer. Double click on “BlueScreenView” to run it on your computer.
- In the BlueScreenView window, you will be able to see the description of the “Dump File“, “Crash Time“, “Caused By Driver” of the minidump files on your computer.
- If you want to jump in for more deep understanding of the dump file, simply double click on it to check the properties of the particular file on your computer.
- If you want to analyze the reason and want to find the remedy for the cause of the problem, simply right click on the dump file and then click on “Google Search-Bug Check+Driver“.
Use windows debugger to analyze the minidump files:
Follow these steps:
- You can download SDK on your computer. Click on “DOWNLOAD THE.ISO” The latest version.
- Mount “KSDKWIN10_MULFRE_EN-US_DV9” .iso file on your computer to visualize the files.
- Double click on “WinSDKSetup” to run the setup on your computer.
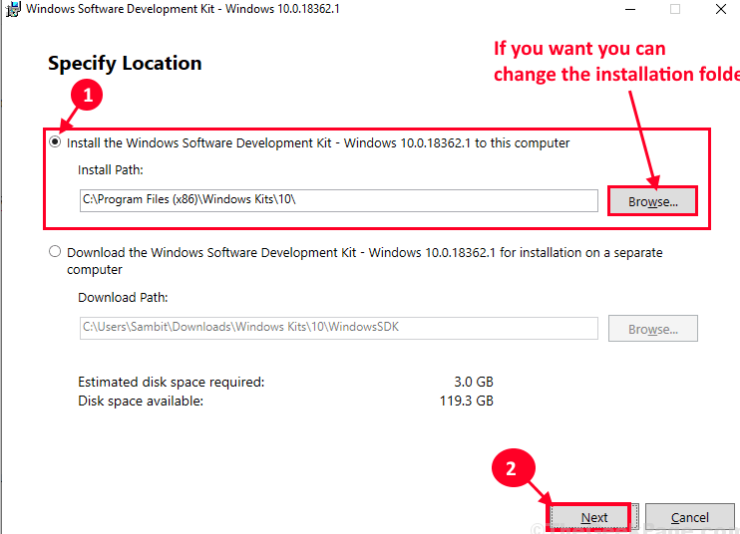
- Choose “Install the Windows Software Development Kit” and then click on “Next“
- You can choose a separate installation directory on your computer by clicking on “Browse“.
- In the License Agreement window, click on “Accept” to accept the agreement to install the kit on your computer.
- When you will be prompted for “Select the features you want to install“, only check the option “Debugging Tools for Windows” and then, click on “Install“.
- When the installation process is complete, simply click on “Close” to close the setup window.
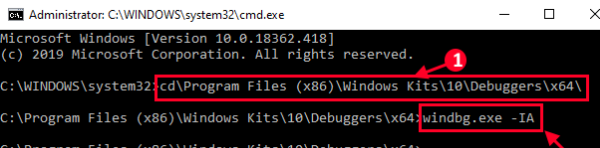
- Press Windows key+R to launch Run window on your computer, type “cmd” and press Ctrl+Shift+Enter to open Command Prompt window with administrative rights.
- In Command Prompt copy-paste these commands one by one and hit Enter after each of them to execute them sequentially on your computer.
- Click on the search box and type “windbg” and then right-click on “WinDbg(x64)*” and click on “Run as administrator” to open WinDbg on your computer. WinDbg window will be opened.
- In WinDbg window, simply click on “File” and then click on “Symbol File Path“.
- In Symbol Search Path, copy this line and paste it in ‘Symbol path:‘. Finally, click on “OK” to save it.

- In the WinDbg window, click on “File” and then click on “Save Workspace” to save the changes.
- Press Windows key+R to launch Run on your computer. Type or copy-paste this folder location and then hit Enter.
- In the Minidump folder, double click on the minidump file you want to analyze on your computer.
- The minidump file will be opened in WinDbg.
- Once, the kernel symbols are downloaded on your computer, click on “analyze -y” to get full analysis of the problem.
- Open Find window, now type “probably caused by” then click on “Find Next“.
Hope this guide is helpful to you.